After the Dashboard application has been launched, the user interface is available through the browser under the host it is installed on and the configured port, for example http://www.example.com:8090/#/.
Home
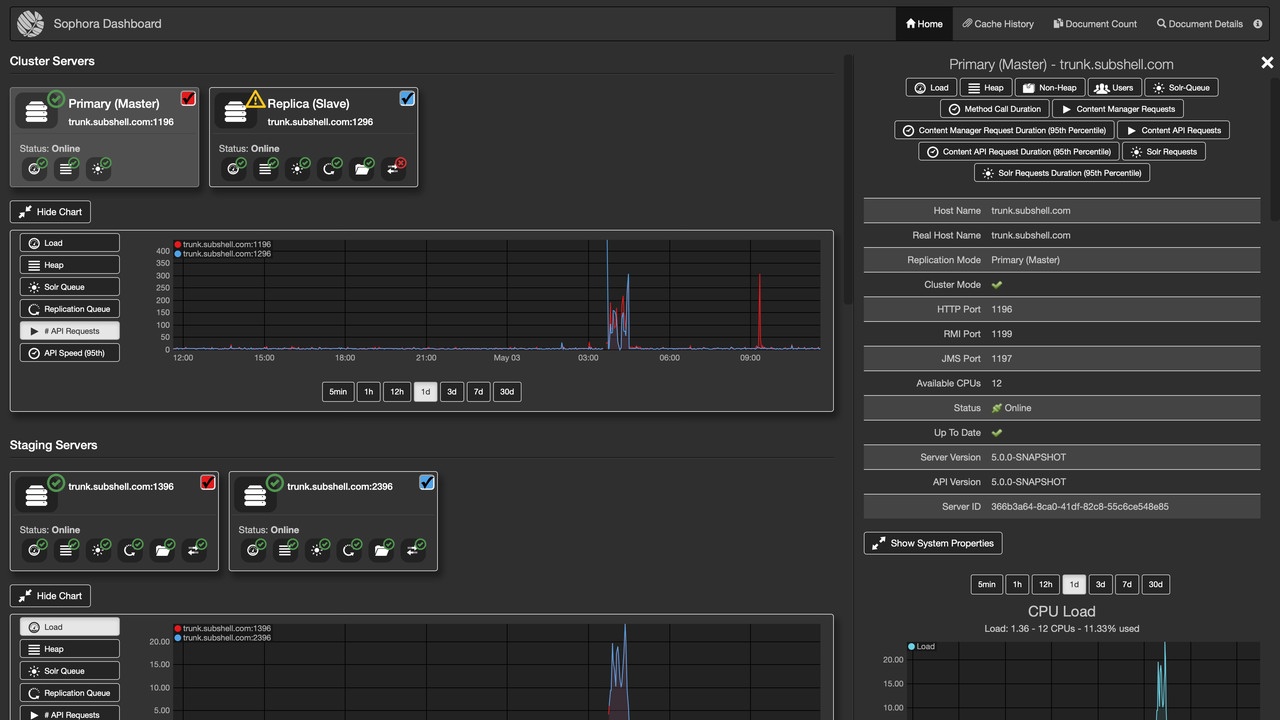
The home view shows groups for the three different types of Sophora components. The Sophora components are grouped by Cluster Servers, Staging Servers and Tools. Each of these groups shows a list of tiles representing each component and a graph section showing relevant time series. If you click on a tile, the details view for this component will open on the right side of the screen. Clicking on its title will show the details view on the whole screen.
Tiles
Sophora Servers have up to seven indicator symbols in the body of their tile, ordered in two rows. The top row shows indicators associated with the Sophora Server itself, while the bottom row shows indicators for the Tomcat server connected to it (if any).
Sophora tools only have the heap-indicator.
| Indicator symbol | Description |
|---|---|
| This symbol depicts the heap state of the Sophora Server or tool. It is usually green but turns red if the used amount of heap space reaches the maximum. | |
| This symbol depicts the CPU load state of the Sophora Server. It is usually green but turns yellow or red if the total load devided by the number of CPUs reaches 75% or 95% respectively. | |
| This symbol depicts the reachability of Solr in the Sophora Server. It is usually green but turns yellow if Solr does not respond to pings within a second of time. | |
| This symbol depicts the synchronisation state of documents in the Sophora Server in comparison to the Sophora Primary Server. Thus, the Sophora Primary Server does not show this symbol. It is usually green but turns red when the numbers of documents in this Sophora Server differ from the one in the Sophora Primary Server. Clicking on this symbol will take you to the document count view. | |
| This symbol depicts the state of the cache queue of the Tomcat. It is usually green but turns red when the queue size exceeds the maximum defined (by default, that's 40000). | |
| This symbol depicts the heap state of the Tomcat server. It is usually green but turns red if the used amount of heap space reaches the maximum. | |
| This symbol depicts the number of threads that are currently busy in the Tomcat server. It is usually green but turns yellow if 33% or red if 66% of the available threads in the pool are busy. | |
| The symbol is only available on Sophora Replica Servers and Staging Servers and depicts the synchronization state of the configuration. |
Besides showing a green or red symbol, an indicator can also display a red question mark. This indicates that the status of the indicator is unknown and cannot be determined.
Each tile has one main indicator symbol. For Sophora Servers this takes the following states:
- green if all other indicators of this tile are green.
- yellow if at least one of the indicators of this tile is not green and nothing causes the main indicator to turn red.
- red if the Sophora Server is offline, the solr indicator is red or the JMX of the Tomcat (if any) does not respond.
Every tile has a checkbox in its top right corner that shows the color with which this component is represented in the graph section. If the box is unchecked, the graph for this server is hidden in the graph section.
Graph Section
In the graph section you can see the values of up to six different metrics for each component over the time. The metrics are:
- Sophora Server heap usage
- load
- Solr queue size
- size of the Tomcat cache queue
- Tomcat heap usage and
- number of busy threads in the Tomcat
You can switch between these metrics by clicking the respective button on the left of the graph section. Also, you can view different resolutions for every metric by clicking the corresponding button at the bottom of the graph section.
Graphs are only shown for those components whose checkbox is checked in their tile. Also, graphs concerning Tomcat values are of course only shown for Servers that have a Tomcat connected.
Details View
The details view shows as a side panel if a tile on the home view is clicked. It expands to full screen if the title of this side panel is clicked.
All Components
For all Sophora components the details view shows a table with information on the selected component such as hostname, different ports and version.
The table is followed by three graphs on heap space, non-heap space and CPU load of that component. Just like the graphs in the graph sections of the home view, they can be switched to different resolutions, but unlike the ones in the home screen, these graphs additionally show committed- and maximum-values for the heap and non-heap metrics.
Buttons at the top of the details view make it easy to navigate to the desired section.
Sophora Servers
For all Sophora Servers two additional metrics are shown as graphs:
- the count of logged in users and
- the size of the solr indexing queue.
Furthermore, for Sophora Servers with a Tomcat connected the following Tomcat metrics are shown as graphs:
- the cache queue size,
- the heap usage and maximum and
- the number of busy and maximum available Tomcat threads.
At last, there is a list of the most recent cache flushes on this server's connected Tomcat. The content of the items in this list is explained in the cache history view section.
Importers
For importers, the details view shows another graph with the number of files that are yet to be imported in all importer instances. Also for each importer instance an own section is shown.
In each of these sections, three more metrics for this importer instance are included as well as a listing for up to the last 1000 imports. This listing can be filtered by the import result and limited to a certain date so that only imports after the defined date show in the listing. Clicking on an import in the list opens a new tab with detailed information about this import.
Document Count View
The document count view shows a comprehensive table with differences in document counts between the Sophora Servers. The view is reachable by clicking the document count symbol on one of the server tiles in the home view or by clicking on the Document Count item in the top menu. There are two modes of the document count view: Solr and JCR.
Solr-Based Document Count View
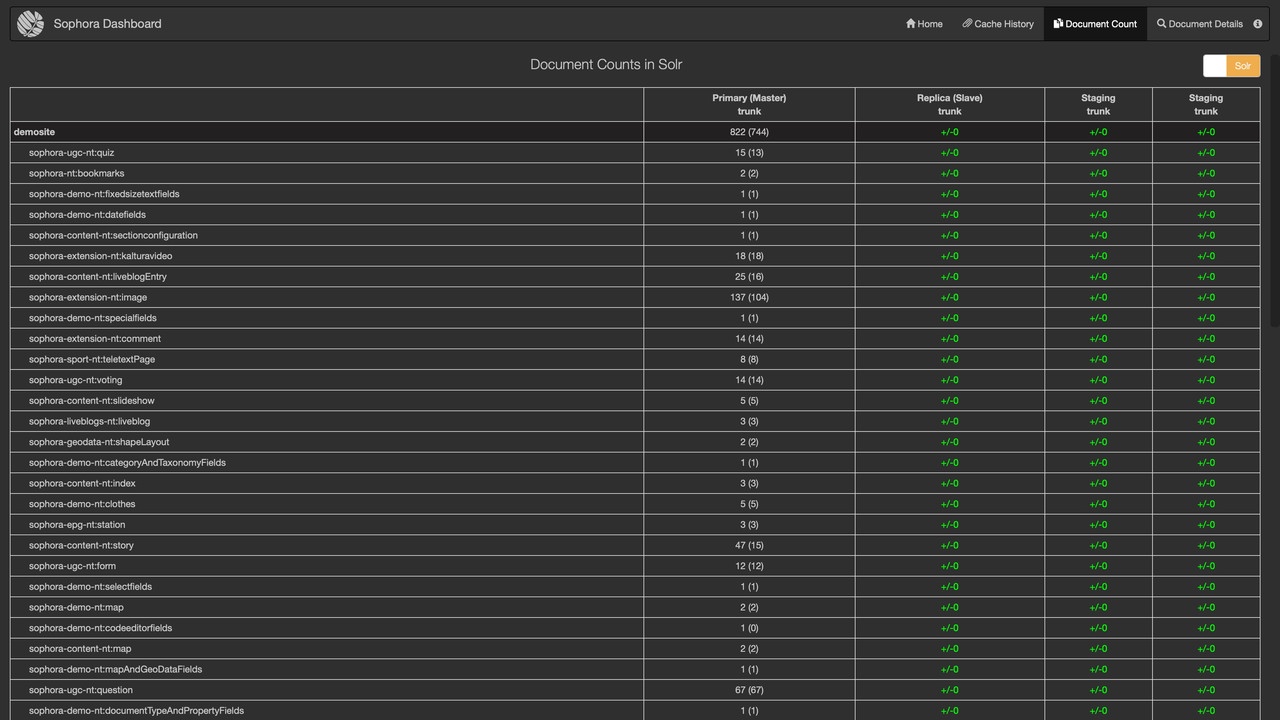
The Solr-based document count view shows the counts of documents of different document types in different sites on the different Sophora Servers.
The table has a row for each configured site in the Sophora system and a column for each Sophora Server. The cells contain the numbers of documents for each combination. When you hover the pointer over a cell, a tooltip will explain the numbers shown.
In the column of the Sophora Primary Server, you can see the total number of documents per site and the number of published documents in round brackets. In every other column the numbers represent the count of documents relative to the Sophora Primary Server. The document counts on failover Sophora Replica Servers are compared against the total counts of the master, and the counts on Staging Servers are compared against the online counts of the master.
If a count differs, the respective cell turns red and shows how many excess and missing documents have been counted. For example, "+3/-1" means there are three documents on this server that are not on the Sophora Primary Server and one document that is on the Sophora Primary Server but missing on this Sophora Server.
If a site is ignored on a certain server, the differences for that site are not being displayed, but the corresponding cell shows a gray dash instead.
Clicking on a row for a site will expand the view for this site and show detailed document counts per document type in that site. The cell in a site-row is the summary of all the type-row cells under it.
Clicking on a cell in a type-row leads you to the document delta view, which shows the actually differing documents.
This view is based on Solr queries. As these queries have a noticable impact on the Sophora Server performance, the Dashboard back end queries each Sophora Server only once per hour. The interval can be configured using the configuration option documentCountInterval.
JCR-Based Document Count View
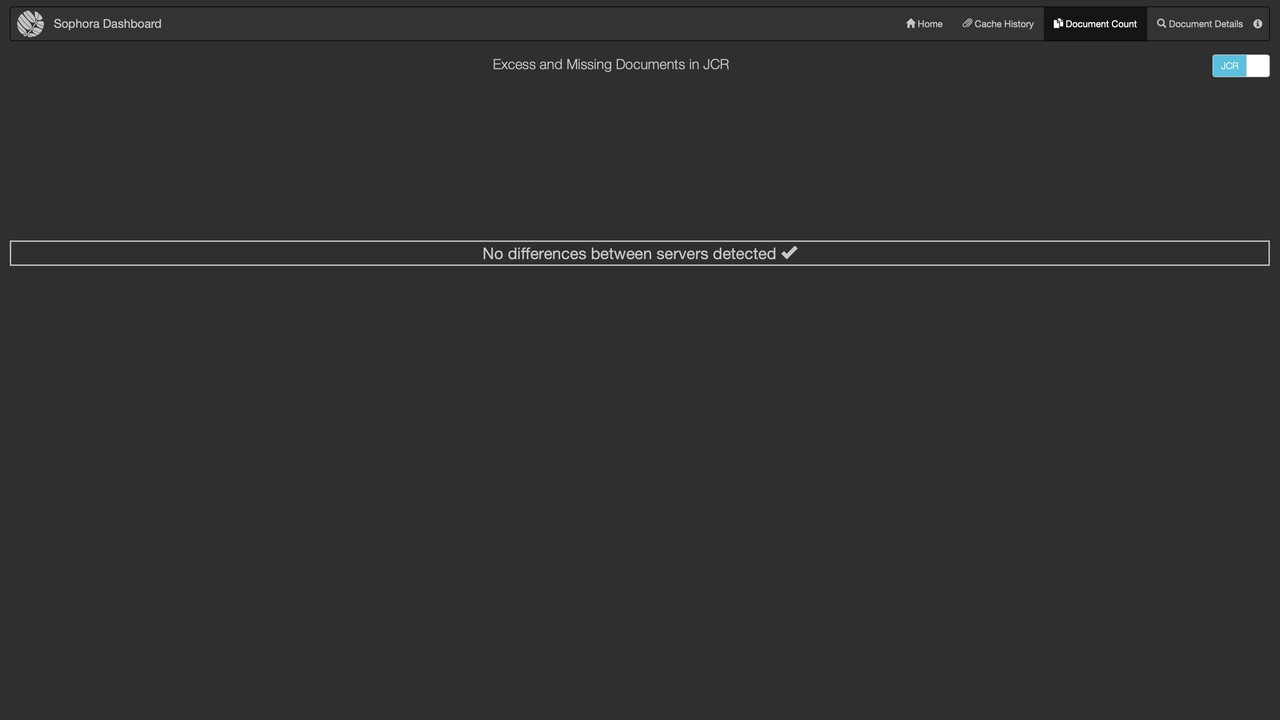
The JCR-based document count view is based on "invertible bloom filters", which each Sophora Server updates continously using data from the Jackrabbit document repository. The filters have the advantage of being very cheap to query and transmit, and in this mode, the Dashboard back end updates the document counts every 30 seconds.
The disadvantage of this mode is that the document count view only shows the differences for each site and document type, not absolute numbers. Also, the difference count can not be shown for a server if the combined difference for all sites and document types exceeds ca. 5000 documents. If some sites are ignored on a Sophora Staging Server no comparison will be done at all, because the set of documents is already different.
The JCR-based document count view must be enabled in the configuration of the Dashboard and the Sophora Servers (see below).
Activating the JCR-based Document Count View
The invertible bloom filters supporting the JCR-based document count view must be enabled in the configuration files of the dashboard and all Sophora Servers. In the dashboard-config.json, enable the configuration option ibfEnabled.
In the sophora.properties of the Sophora Servers, enable the configuration option sophora.ibf.enabled. You will then see a toggle button in the document count view for switching between the Solr- and JCR-based views.
The invertible bloom filters may possibly be enabled by default in future Sophora versions.
Document Delta View
Clicking on a table cell in the document count view opens the document delta view. This view lists all documents for a specific document type and site on two Sophora Servers that are only present on one of the two servers. Each document is represented by a tile that shows its most important information. Clicking on one of those document tiles opens the document details view for this document.
Document Details View
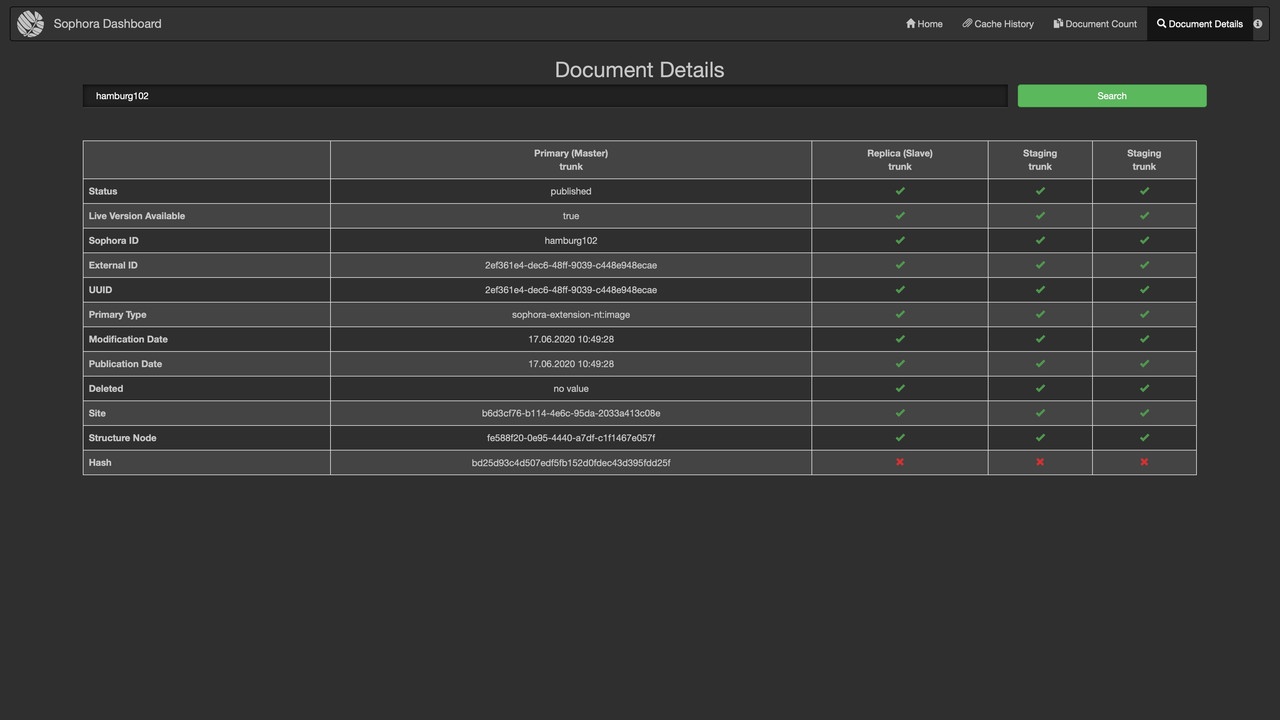
In the document details view the state of a single document on the different Sophora Servers can be looked up. First, you will only see a search bar that takes a Sophora-ID. Upon entering a Sophora-ID, information about that document is presented in a table.
Like in the document count view, every Sophora Server has its own column. The row of the Sophora Primary Server shows the most important information on the document, while the colums for the other servers merely show a green tick as long as the value for that property does not differ from the value on the Sophora Primary Server.
If it does differ, a red cross is shown and hovering the pointer over this icon brings up a tooltip with the differing value. Since the search term is reflected in the URL, the link to a specific document details view can be copied and, for instance, sent via e-mail.
Cache History View
In the cache history view you can check cache flush orders across all the Tomcats. First you will only see a search bar that takes a UUID, a flush key or a resource name. Upon entering one of the above, for each Sophora Server with a connected Tomcat a listing is shown.
Each of these listings contains the cache flushes that match the given search term. Since the search term is reflected in the URL, the link to a specific cache history view can be copied and, for instance, sent via e-mail.
If you open the cache history view through clicking on an entry in a server's details view, the view will be opened with a pre-defined search term. This way you can check if the cache flush for this order has been performed on all Tomcats across the Sophora system.
Email Notification Service
If the configuration contains a mail section, the Dashboard application will send mails whenever the main indicator for any tile remains red for longer than the configured time period. The mail gets sent to all configured recipients' email addresses and contains an explanation of the problem.
Configuration Differences
This view provides an overview of differences regarding the configuration between a Sophora Replica Server and its Sophora Primary Server. The view is accessible using the icon "Configuration Differences" in the tile of a server on the overview page.
Usually, there should not be any differences. But if there are differences, they are depicted here in detail and the view provides the necessary information to correct the situation. Since each difference must be the result of a synchronization exception between the servers, the cause of the exception should be investigated.
The view provides one section for each of the configuration entities. Each difference is visualized by a side by side difference view comparing the current version of the entity in a Sophora Replica Server and a Sophora Primary Server.
A Sophora Replica Server with configuration differences should not be propagated to the Sophora Primary Server in a cluster. The differences must be manually resolved prior to a cluster switch. A concrete configuration difference can be resolved by editing the entity using the DeskClient. Saving the configuration entity triggers its synchronization to the Sophora Replica Servers.
The following configuration entities are compared for the different server modes:
Primary: Is the reference for the comparison and is therefore always in sync.
None: A server in the mode replication mode "none" is not connected to a Sophora Primary Server. Hence, no configuration differences can be determined.
Replica and Staging Server:
- CNDs
- Document Proposal Sections
- Structure Node Documents
- All System Documents


